Measuring Curvature of Curves


Measuring Curvature of Curves |
|
This command allows measuring curvature and the curvature radius of the selected curves. You can select edges and 3D Paths to measure curvature.
The command "QC: Show Curve Curvature" can be called via:
Icon |
Ribbon |
|---|---|
|
Measure→ Geometry analysis → Curve Curvature |
Keyboard |
Textual Menu |
<QC> |
Tools > Geometry Analysis > Curve Curvature |
Upon entering the command, you need to select one or several elements, whose curvature needs to be measured. To select, use the options:
![]() <E> Select Edge or cancel Edge selection
<E> Select Edge or cancel Edge selection
![]() <T> Select 3D Path
<T> Select 3D Path
To cancel selection of a curve, you need to click it again. To cancel selection of all curves, use the option:
![]() <U> Cancel selection
<U> Cancel selection
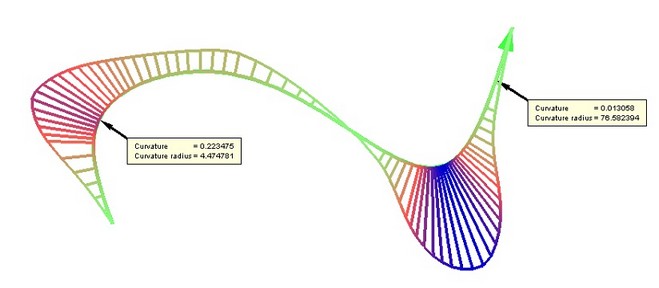
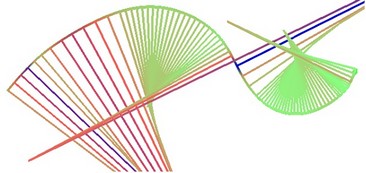
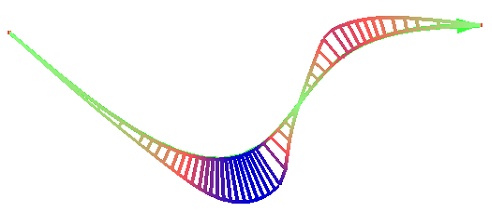
Right after selecting an element, its curvature will be measured and displayed in the 3D window as a multiplicity of colored lines stemming from the curve, called curvature porcupine quill. You can modify two parameters: "Curvature" and "Radius". Depending on the selected parameter, rendering in the 3D window will appear differently. |
|
If "Curvature" is selected, the colored quill lines will be pointing in the direction away from the center of curvature. The lines originate on the curve. Their length corresponds (to a certain scale) to the curvature at the point, from which the line originates. The scale coefficient that relates the curvature of the curve and the length of the colored lines is defined in the properties window by the parameter "Size".
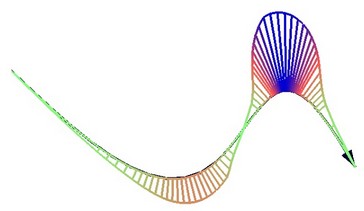
If the "Radius" parameter is evaluated, the colored lines will be connecting points on the curve with their respective centers of curvature. The length of the colored lines corresponds to the radius of the curve's curvature. The density of the colored lines is controlled by the "Density" parameter both in the case of curvature evaluation and in the case of the curvature radius evaluation.
Working with the tab "Colors"
The quill lines are painted in different colors, depending on the value of the curvature at the point. Color distribution within the range of the measured parameter is set up on the tab "Colors", located in the properties window. A color scale is displayed on the tab. The values at the left of the scale correspond to certain colors on the scale. The black triangular markers at the right of the scale are used for adjusting the scale. Each marker relates to a certain color. The colors of the scale change smoothly from one marker to another. You can move the markers along the color scale. To do this, you need to "grab" a marker with the mouse and drag it to the new position. As you do this, the color scale will change its appearance, and so will the image in the 3D window. To define the color of a certain marker, right click ![]() this marker, and in the coming up menu select "Color". After that, you can select the color in the standard color selection window. The scale can have two markers (for the maximum and the minimum values), or more. To add a marker, right click
this marker, and in the coming up menu select "Color". After that, you can select the color in the standard color selection window. The scale can have two markers (for the maximum and the minimum values), or more. To add a marker, right click ![]() where you want to add it, and in the coming up menu select "Add". To delete a marker, right click
where you want to add it, and in the coming up menu select "Add". To delete a marker, right click ![]() this marker, and in the coming up menu select "Delete".
this marker, and in the coming up menu select "Delete".
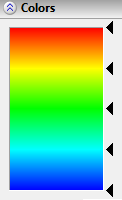
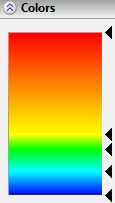
The marker placement scheme and the colors can be saved and unloaded to a file (the file extension is "*.col"). To do this, use the menu items ("Save" and "Load"), coming up upon right clicking ![]() anywhere on the "Colors" tab.
anywhere on the "Colors" tab.
![]()
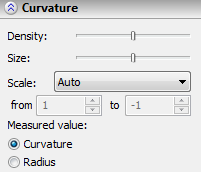
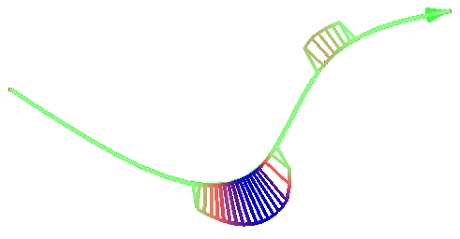
The range of the color scale for the measured parameter can be modified as well. To do this, use the parameter "Scale" at the top of the properties window. By default, the parameter is set to "Auto". This means that the minimum and maximum values on the scale correspond to the minimum and maximum parameter values of the selected elements.
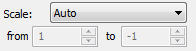
In this case, the entries "from" and "to" cannot be edited, since these parameters are defined automatically. Note that the quill lines defining the amount of curvature are displayed only on the portions of the curve whose curvature falls within the specified range. Thus, if using the automatic scale, the colored quill will be displayed along the whole curve.
If the parameter is set to "Custom", then the values in the entries "from" and "to" can be specified manually. Note that the quill will be shown only along the portions whose curvature falls within the specified range.
![]()
Thus, for example, the minimum curve of the curve shown on the diagram is equal to zero. Therefore, setting a positive value in the "from" input box (in the example, set to 0.18), will make the quill disappear on some parts of the curve. The quill coloring will also be different.
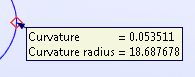
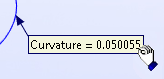
Besides the color-coded curvature display, a provision is made for reading the curvature at a specific point. To do this, use the option:
![]() <C> Measure curvature at arbitrary point
<C> Measure curvature at arbitrary point
When this option is active, the pointer changes its shape. As the pointer approaches the curve, the position on the curve where the curvature is measured is marked by the red square. The value of the curvature and the radius of curvature at the point appear in a tooltip next to the pointer. |
|
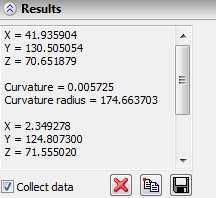
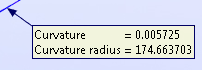
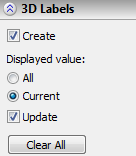
If the option "Collect data" is set on the tab "Results", then, upon clicking a point on the curve, the point coordinates, curvature and the radius of curvature will be written in the curvature measurement log. The created log can be copied to the clipboard (the button To clear the log, use the button Besides collecting data into the log, you can create 3D labels when clicking a point on the curve. A 3D label appears as a semi transparent text in the 3D window, containing the results of the conducted measurements and an arrow marking the point where the measurement was done. 3D labels are handled by using the parameters located on the tab "3D Labels". |
|
The option "Create" determines whether to create new 3D labels upon clicking a point on the curve.
If the option is set "Displayed value: All", both values will appear by the newly created 3D label: the curvature and the radius of curvature.
If, instead, the option "Displayed value: Current" is set, then the newly created label will show only the parameter that is currently being measured. If the "Update" option is set, then the 3D labels that show the current value are updated automatically when switching to a difference type of the measured value. To delete all 3D labels, use the button [Clear All]. |
|
3D labels are displaced at some distance (in the screen coordinates of the 3D window) from the point they corresponds to, and participate in the motion when the screen is spun. This relative position can be modified. To do this, move the pointer to the 3D label (in this case, the pointer will change its appearance) and drag the 3D label to the new position. |
|
To find the point of maximum curvature, use the option:
![]() <M> Find point with maximal curvature
<M> Find point with maximal curvature
When using this option, the system will automatically create a 3D label indicating the point on the curve with the maximum curvature. A distinctive feature of such 3D label is that it is red.